
Urban Heat Island
A Sensor Cloud-Based Community-Centric Approach for Analyzing and Mitigating Urban Heat Hazards
Extreme heat in light of climate change is increasingly threatening the health and comfort of urban residents. Understanding spatio-temporal patterns of heat exposure is a critical factor in directing mitigation measures. Current heat vulnerability indices provide insight into heat sensitivities within given communities but do not account for the dynamic nature of the human movement as people travel for different activities. High-quality temperature data at a finer spatio-temporal scale is critical for analyzing the risk of heat exposure and hazards in urban environments. The variability of urban landscapes makes cities a challenging environment for quantifying heat exposure. Most of the existing heat hazard studies have inherent limitations on two fronts; first, the spatio-temporal granularities are too coarse, and second, the inability to track the ambient air temperature (AAT) instead of land surface temperature (LST). The two primary objectives of this project were to develop a new sensing framework to acquire hyperlocal ambient air temperature (AAT) from urban areas and develop a heat exposure model for urban residents.
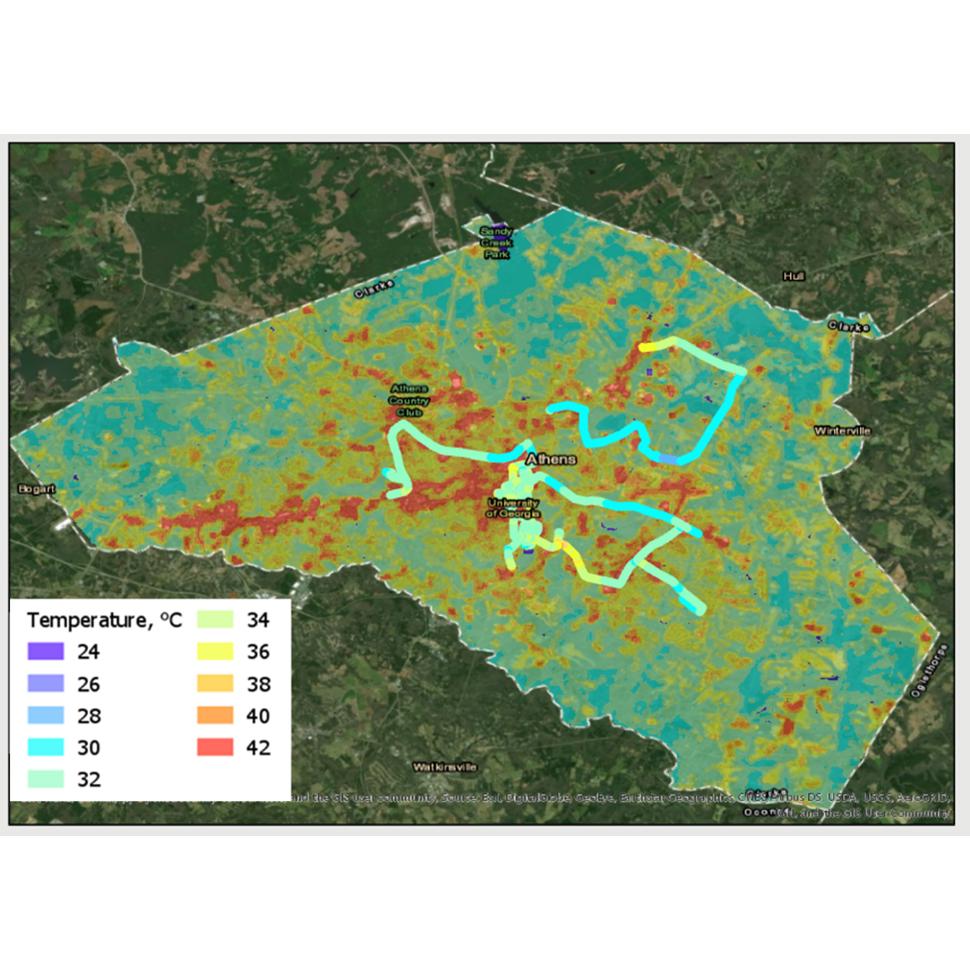
First, we investigated an integrated approach for mapping urban heat hazards by harnessing a diverse set of high-resolution measurements, including both ground-based and satellite-based temperature data. We mounted vehicle-borne mobile sensors on city buses to collect high-frequency temperature data. Our research also incorporated key biophysical parameters and Landsat-8 satellite LST data into machine learning modeling to map the hyperlocal variability of heat hazards over areas not covered by the buses. The vehicle-borne temperature sensor data showed large temperature differences within the city, with the largest variations of up to 10 °C and morning-afternoon diurnal changes at a magnitude around 20 °C. Random Forest modeling on noontime (11:30 am – 12:30 pm) data to predict AAT produced accurate results with a mean absolute error of 0.29 °C and successfully showcased the enhanced granularity in urban heat hazard mapping. These maps revealed well-defined hyperlocal variabilities in AAT, which were not evident with other research approaches. Urban core and dense residential areas revealed larger than 5 °C AAT differences from their nearby green spaces.
Second, from the high resolution, AAT data from Objective 1, a new Dynamic urban Thermal Exposure index (DTEx) was developed that captures the varying heat exposure within urban environments. We developed the DTEx to understand human heat exposure patterns in a mid-sized city. This index incorporates the human movement pattern and the heat hazard pattern obtained via novel and advanced techniques. We generated the human movement pattern from large-scale, anonymized smartphone location data. DTEx between 2 and 12, indicating low to high thermal exposures. Several high-temperature spots associated with a large volume of foot traffic are successfully identified through this model. We observed the hottest spots at shopping plazas but not specifically in the urban center. During the selected football gameday, the exposure index surged across most places near the football stadium but was reduced considerably further away. The sensing framework developed in this study can be easily implemented in other urban areas, and findings from this study will be beneficial in understanding the heat vulnerabilities of individual communities.
Funding and Collaborators:
-
National Science Foundation